Weebou Editorial Team
 7 min read
 In this article
A little preparation
Choose one clear question and a small collection of large, safe objects, such as ten toys or a basket of blocks. Make a simple recording page with a line for each group and agree what each mark means before you start. Let your child decide how to group the information, since the choice of rule is part of the thinking.
Keep the question and the counting rule the same until the observation is finished. If a result surprises you, check the marks together rather than changing them to match expectations. Remember that a small sample only describes those objects or days; it does not prove something about all toys or all weather. Allow ten to twenty minutes and keep the paper for a later comparison. If you want to link this to numbers, these math activities for preschoolers include counting and comparing games.

Ideas to try together
Toy colour survey
Sorting toys by colour is a familiar activity, and counting each group turns it into data. Agreeing how to treat multicoloured toys before you start shows children that a counting rule must be decided first, and putting one mark per toy lets them compare the written record with the real piles in front of them.
 You’ll need
- 10 to 15 large toys or blocks of several colours
- A sheet of paper with a line for each colour
- A crayon in each colour
- A tray
How to do it
- Gather a small group of large toys and ask which colour appears most often.
- Decide together how to count a toy with two colours, for example by the biggest colour.
- Sort the toys into piles on the tray, one pile per colour.
- Draw one mark on the paper in that colour for each toy.
- Compare the marks with the piles and count which has most and least.
- Check by putting the toys back in a different order and counting again.
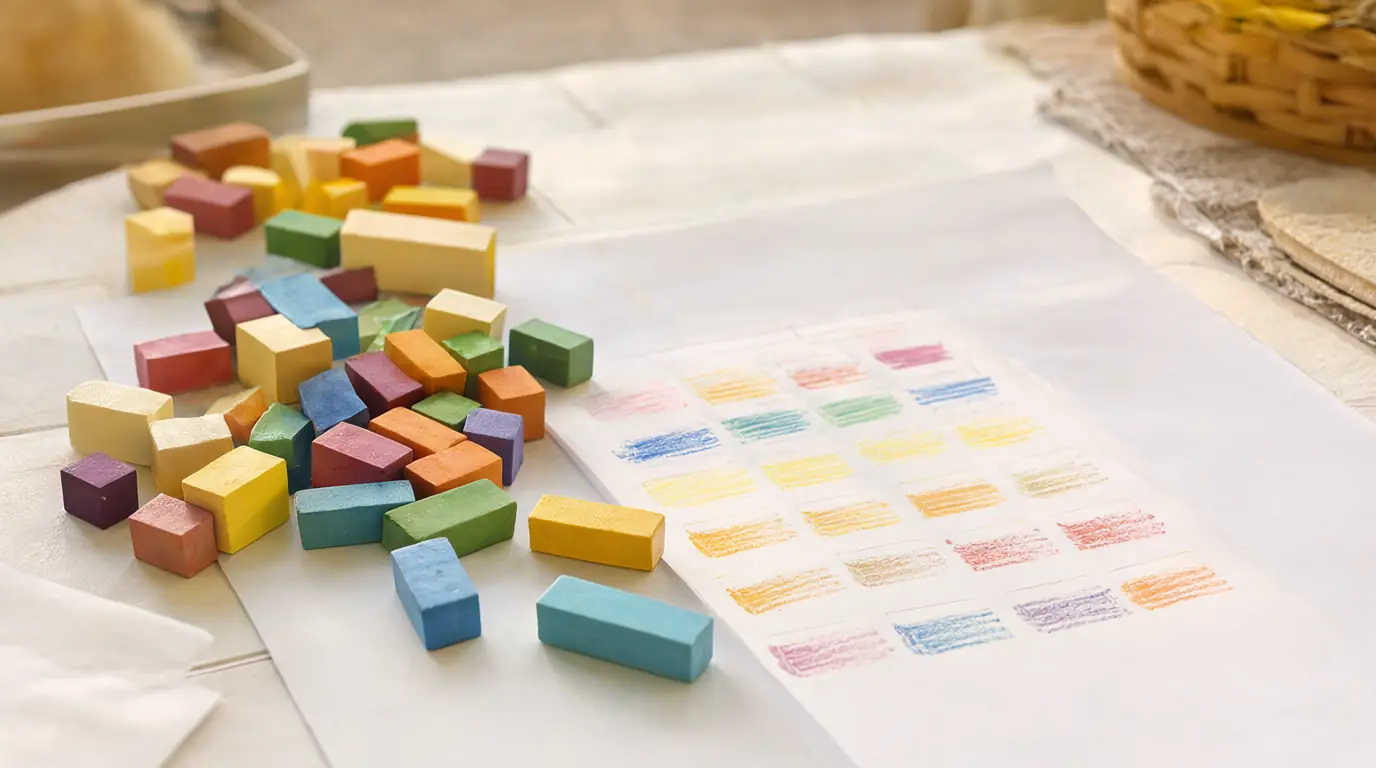
Make it your own: Younger children can sort into two colour groups and count out loud. Older children can write numbers beside each line and make up a question for you to answer from the page.
Weather tally
Looking out of the same window each day and recording the weather builds a small set of observations over time. Children learn that a record is made of many days and that you need to wait before you can say what was most common.
You’ll need
- A window you can look out of each day
- A sheet of paper divided into columns
- Stickers or drawings of sun, cloud, rain and wind
- A pencil
How to do it
- Choose a time each day to look out of the window, such as after breakfast.
- Decide which pictures stand for which kinds of weather.
- Look out together and choose the picture that fits best.
- Stick it in the next square on the sheet.
- After five to seven days, count the pictures in each column.
- Say which weather you saw most and note that it describes only those days.
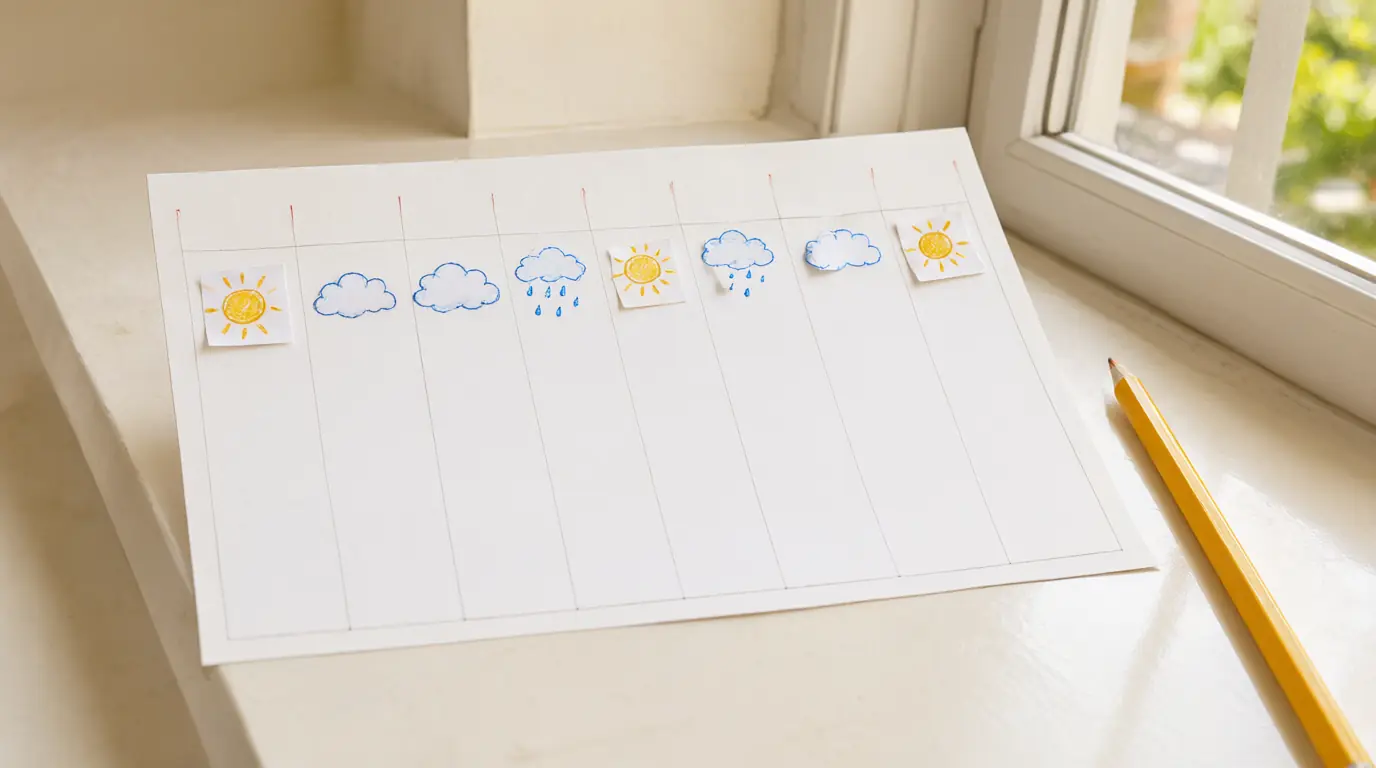
Make it your own: Younger children can choose between sun and not sun. Older children can add a column for temperature words, such as warm or cold, and compare days.
Build a block graph
Stacking one block for each answer turns people's choices into a graph that can be read at a glance. Children see that taller means more, and that a different group of people might choose differently.
You’ll need
- About 20 blocks of the same size
- 2 picture cards showing two activity choices
- A flat surface
- A few family members willing to answer
How to do it
- Choose a question with two answers, such as would you rather play outside or draw.
- Put the two picture cards at the bottom of two columns.
- Ask each person to choose and let them pass if they prefer.
- Add one block above the matching picture for each answer.
- Compare the heights and count the blocks in each column.
- Ask whether a different group of people might choose differently.
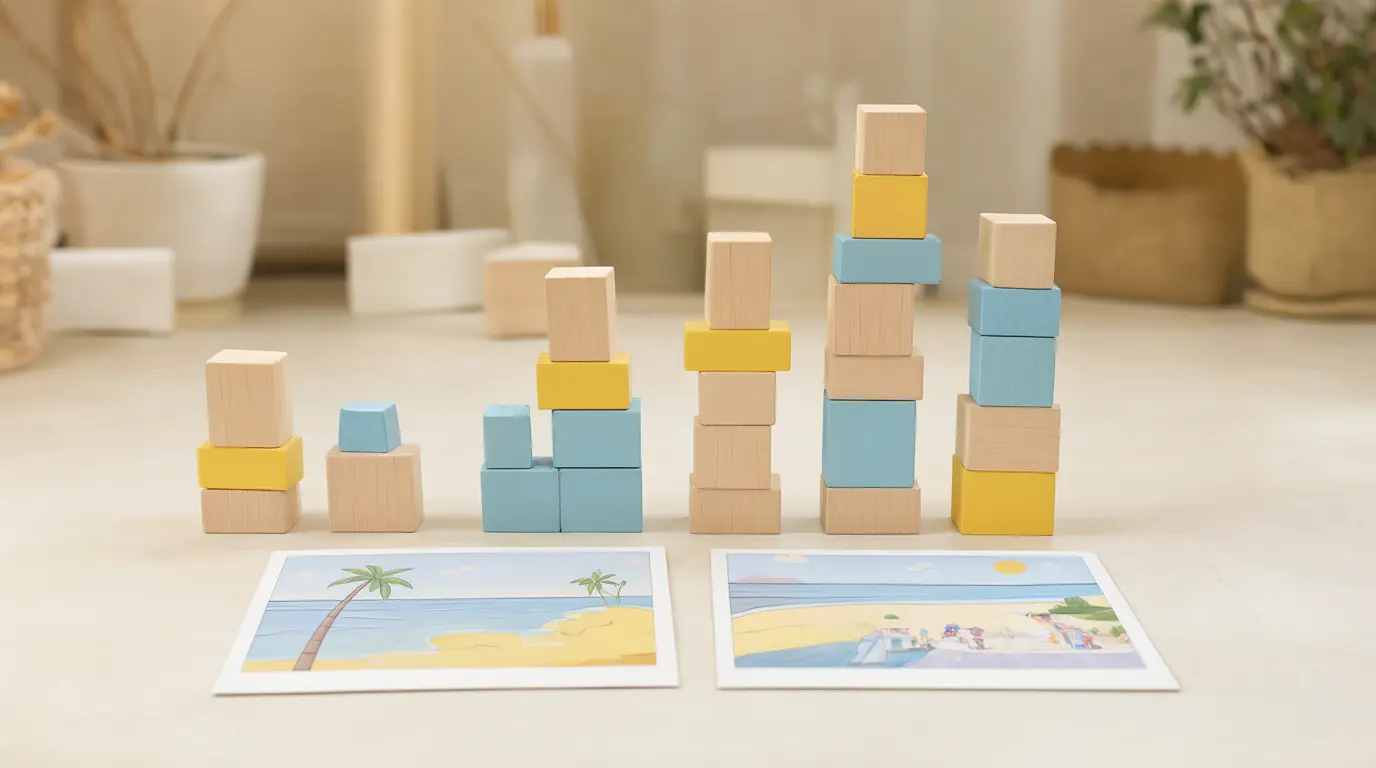
Make it your own: Younger children can build the graph with you holding the cards. Older children can add a third choice or take the survey with friends and compare results.
Change the question
Sorting the same objects in two different ways shows that the question decides what the data looks like. The collection does not change, but the groups do when the question does, and children can see this by comparing two drawings of the same set of buttons, spoons or small toys side by side.
You’ll need
- 10 to 12 familiar objects, such as buttons, spoons or small toys
- 2 sheets of paper
- Crayons
- A tray or large plate
How to do it
- Put the objects on the tray and look at them together.
- Choose the first question, for example which are big and which are small.
- Sort them into two groups and draw each group on a sheet of paper.
- Put them all back together and choose a different question, such as which are round.
- Sort again and draw the second set of groups.
- Lay the two sheets side by side and describe how the groups changed.
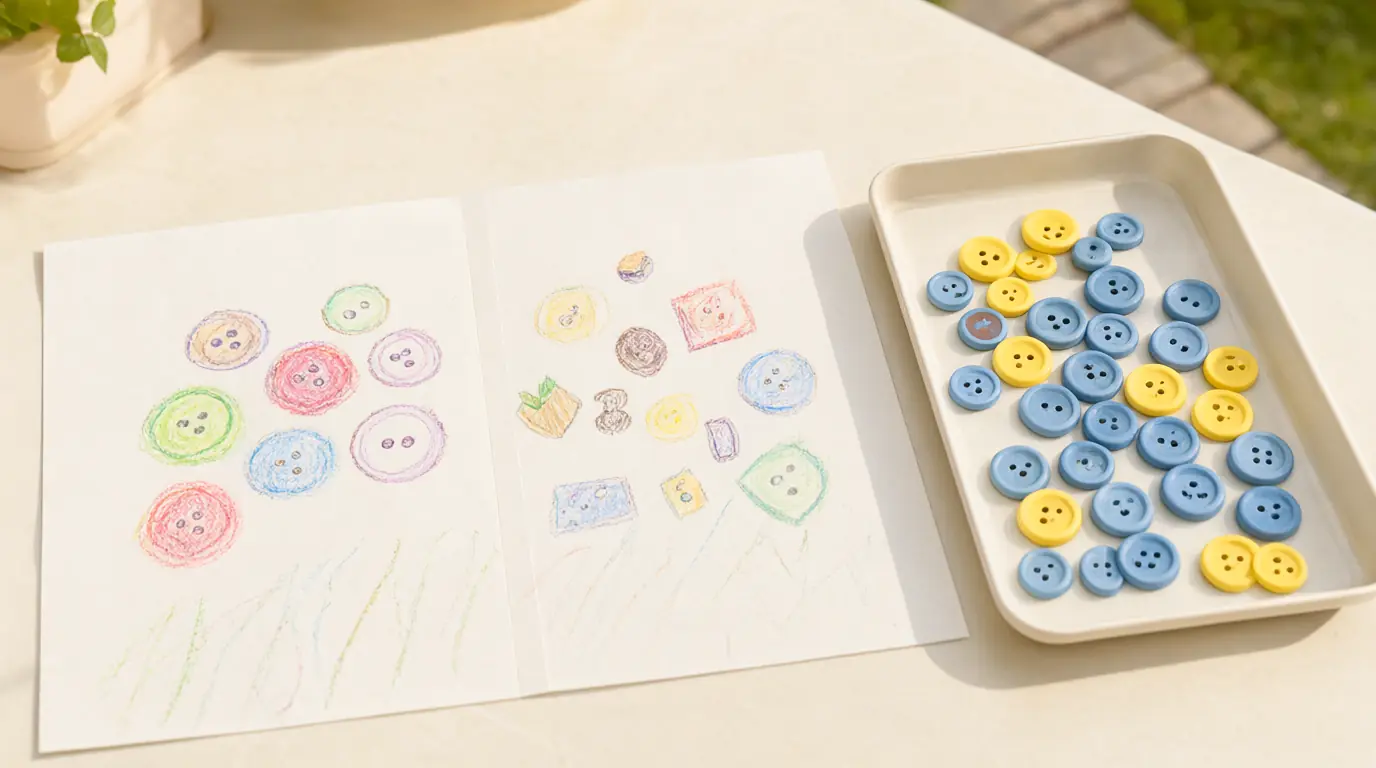
Make it your own: Younger children can sort by one simple feature with help drawing. Older children can sort by two features at once or predict how many will be in each group.

Make it work for your family
When children make a tally, check that each mark means one thing and that nothing is counted twice. If they lose track, move counted items to one side. Ask what you could find out next, for example whether the result would be the same tomorrow or with a different group.
Talk about what the data cannot tell you. A pile of mostly red toys does not mean red is the best colour; it shows what is in the box. Keep language simple: more, fewer, the same, the most. A page of marks can be kept as a record to compare with later. For more ways to practise sorting, try colour-sorting games or some science games.

Parents also ask
Can young children really do data science?
They can do the early habits behind it: asking a question, collecting simple information, recording it and talking about what it shows. Counting toys or tallying weather uses the same thinking on a small, concrete scale.
What is the difference between data and a guess?
Data is information you have actually collected, such as a count or a tally, while a guess is an idea about something you have not checked. Saying how you know something is a good first step towards the difference.
How many items should I use for a first survey?
Between eight and fifteen is plenty. A small, clear set lets children count accurately and compare groups without losing track, and you can always add more later or repeat the survey on another day.
Choose materials and activities that suit your child, supervise as needed and adapt the ideas to their interests and abilities. About our editorial approach